Note: I originally published this under the web page of one of my previous employers. Since then, the company was acquired and their page was taken down. I decided to re-post this here as it is one of my most referenced posts, and the content is still applicable.
In our previous blog post, we discussed how Angular and AngularJS applications are generally structured from an application security point of view. This time, we will explore different ways in which we can dynamically debug Angular applications whether the code is minimized or not. But why would that matter to application security researchers? By debugging Angular applications from the browser console, we can manipulate functions and scope variables to our liking. This can allow us to trigger behaviors that can help us discover front and back-end bugs, such as missing function level access control and insecure direct object reference. Furthermore, the techniques shown in this post can make it easier to examine bundled and minimized Angular code by leveraging tools provided by your browser’s developer tools.
It’s time to mess with Angular code! Let’s begin by learning to debug Angular 1.x applications dynamically.
ANGULAR 1.X
Let’s say that you are assessing an Angular 1.X application, and you are interested in changing the behavior of a service function. We can do that from the developer tools console in the browser by following a few simple steps. The first thing you’d want to do is of course to open the developer tools console. You can do this is by right clicking on any page element and clicking on “Inspect” if you are using Chrome, or “Inspect Element” if you are using Firefox. Next, click on the “Console” tab.
Now that we have the console tab opened let’s obtain a reference to the service that interests us. In this case, we are interested in the AuthService. We can open up the browser console and do the following:
var injector = angular.element(document.body).injector();
var authService = injector.get('AuthService');
The authService variable now contains all exported functions used by that the AuthService. You can obtain the name of the service that interests you by exploring the code from the “Sources” tab of the developer console. A lot of Angular 1.X applications are not minimized before they are deployed to production, so reading their code should be a straightforward process.
Note that the browser will give you autocomplete suggestions as you type authService.. This is useful as it tells us what functions and variables are available for us to work with and modify.
Now let’s change the function isLoggedIn to return true.
authService.isLoggedIn = function(){ return true; }
Now what? Nothing happened! Well, Angular is not aware of the change yet, so you need to force it to run a digest cycle:
angular.element(document.body).scope().$apply();
After doing the above you may notice additional UI elements appear on the screen that you can start messing with, as other functions in the application will assume that you are logged in when running AuthService.isLoggedIn().
What if we wanted to change a scope variable? You can do so by obtaining a reference to the controller that holds the scope variable that you want to manipulate. The first step is to obtain a reference to the element on the page that is managed by that controller. The easiest way to do this is to select that element using the “elements” tab of the developer tools console and to type $0 in the console, which should return that DOM object. We will use this technique to get our controller reference. For instance, notice in the image below how we have selected the <body> element, which is controlled by BaseController. After typing $0 we see that DOM element printed in the console.

Now let’s say that you found an element managed by a controller named AdminController by examing the page mark up. To get a reference to that controller, you would need to do the following:
var adminController = angular.element($0);
Perfect, now we have access to all scope variables in that controller. Let’s change the isAdmin scope variable value to true:
adminController.scope().isAdmin = true;
Lastly, let’s make Angular aware of the change by calling the digest cycle:
angular.element(document.body).scope().$digest();
Similarly, you can also update controller functions. For instance, in the code snippet below we are changing the expireSession method from the root controller so that it does nothing.
angular.element($0).scope().$root.expireSession = function(){return;};
ANGULAR 2+
Ok, but what about Angular 2+? Any fancy tricks for dynamic debugging? Angular 2+ applications are not as easy to manipulate using the browser console as Angular 1.x. Most Angular 2 applications are loaded in the browser in production mode (unless of course the dev team accidentally deployed the application in development mode), which limits what we can do and what is available to us as far as debugging functions.
When Angular 2+ applications are deployed to production, the enableProdMode() function is called before the application module is set up. This makes it so that Angular skips building the debugging elements tree, which is what would allow us to debug the application dynamically from the browser. If that is the case, your best bet is to use a tool like Burp to intercept the script files that contain the JavaScript code that makes a call to enableProdMode() and remove it before it reaches the browser.
There is a catch, however. If the application code were minimized or bundled with (webpack)[https://webpack.js.org/], you would not be able to just search for enableProdMode in Burp, as webpack tries to reduce the size of bundled JavaScript files by renaming functions with random short names. This means that the function could be called something like Qa() or V(), and it could get renamed a few more times before the application calls it. There is a solution for this though, and that is to find and change the function as implemented by the Angular library code. The enableProdMode() function will look something like this in the webpack’ed scripts file:
function Oa(){if(ib)throw Error("Cannot enable prod mode after platform setup.");ge=!1}
Next, search for the string Cannot enable prod mode after platform setup or part of it and change the function (before the browser receives it) to something like this:
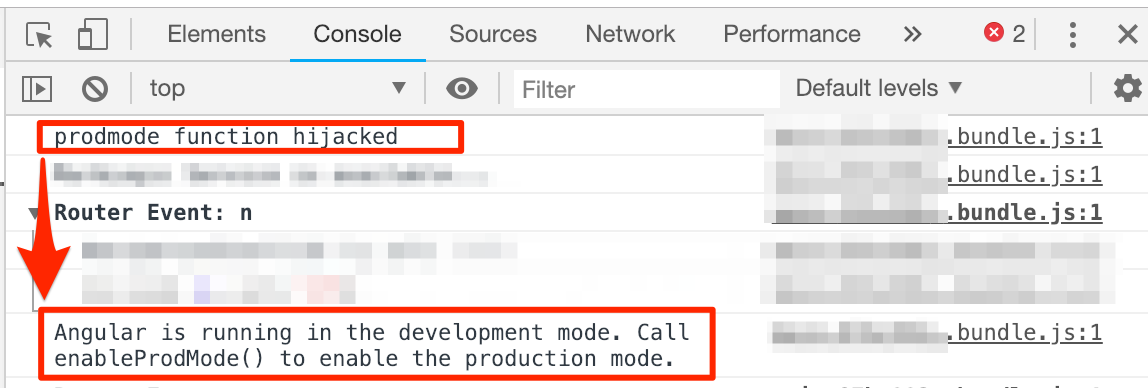
function Oa(){console.log("prodmode function hijacked")}
If done successfully you will see something like this in the browser console:

This process can also be automated using a tool like Gorp, which looks for and modifies the function that enables production mode and re-writes it so that the application can run in development mode when it loads in the browser.
Great, we are running the app in development mode, now what? The first thing we need to do is to inspect the current state of the Angular component with which you want to work.
Select an element in the page using the developer tools and type the following in the console:
var state = ng.probe($0);
Note that you would get null if the application were still running in production mode.
 .
.
Now we can get an instance to the component that we selected in the previous step.
var component = state.componentInstance;
Since we have a reference to the Angular component, we can now manipulate component variables and functions as shown below:
component.showAllDiscountCodes = true;
Lastly, we invoke the change detector on our component to apply our changes:
ng.probe($0).injector.get(ng.coreTokens.ApplicationRef).tick();
But what about services? In Angular 2+, services are injected into components. Those components can then use a service reference to call whatever functions that service provides. Injected services are similar to static helper classes in languages like C#. All we need to do is find and get a reference to that service variable and make our changes as we did above.

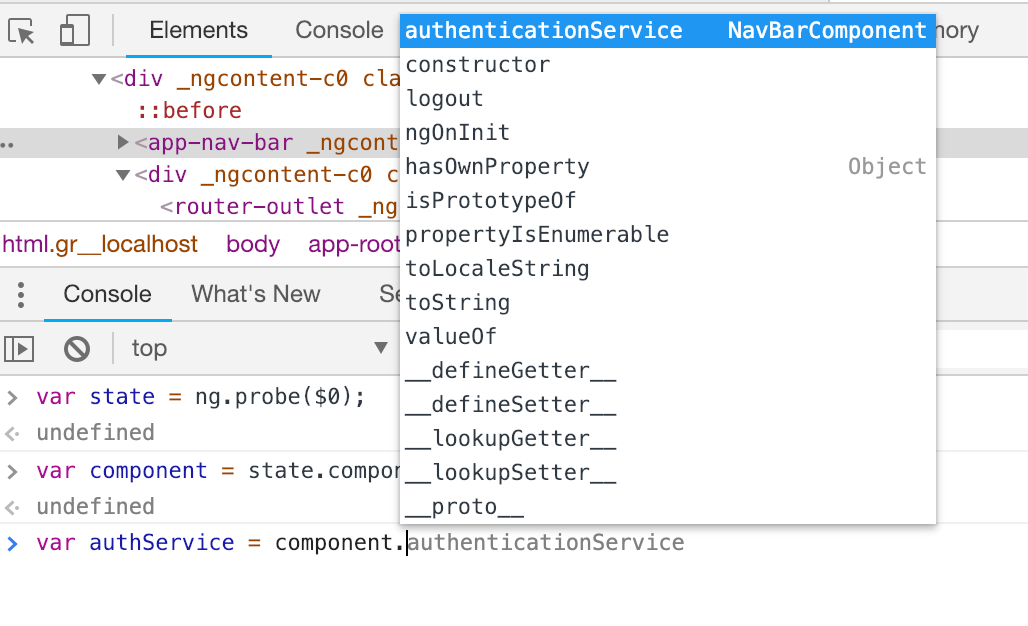
Notice in the image above how the browser tries to give us a list of suggested variables. This is extremely useful when testing Angular 2+ applications, as the code is often minimized and not easy to read. This technique helps us understand the code without having to hurt our eyes by reading minimized code.
WRAP UP
Now, am I telling you to do this for every application that you work with that uses Angular? Definitely not! Nevertheless, this blog post should give you the tools you need to conduct an in-depth analysis of Angular code when necessary. Furthermore, detailed Angular code analysis should not be a substitute for good ole’ penetration testing methodologies that we use in every assessment.